
We often get asked this question and the answer sometimes surprises people as the answer may not be as much you think (or have read).
The ASFA Retirement Standard provides an annual budget for a ‘comfortable’ lifestyle in retirement, and a corresponding figure for the amount of super savings needed at the time of retirement (assumed age of 67).
• As of September 2024, the savings amounts are: $595,000 for a single person and $690,000 for a couple
• A recent survey of Australian adults on the amount of super they require for a comfortable retirement yielded results broadly consistent with the Retirement Standard
• That said, the distribution of (required) balances reported in the survey is very wide
• This suggests a greater role for the provision of quality information on retirement – to help Australians better understand and set their personal retirement goals.
How much super do Australians think they need?
For any individual, the amount of superannuation needed for a comfortable standard of living in retirement depends on a range of personal factors and circumstances, which can change over time.
These include:
• Expected age of, and duration of, retirement
• Desired standard of living during retirement
• Any potential sources of retirement income other than superannuation, such as the Age Pension and private wealth.
Given this, it is not surprising that within the Australian population, individual’s estimates of required superannuation savings will vary markedly. Survey participants were asked to estimate the amount of super savings they think they need to support a comfortable standard of living in retirement.
For four age cohorts, Chart 1 shows the distribution of the survey responses. Of particular relevance to the 65+ age cohort, the group of respondents includes people who have already retired. For each of the age cohorts, the distribution of estimates is fairly similar. Around 30 per cent of respondents consider they need between $500,000 and $1 million, where this represents – broadly speaking – the middle of the distribution of responses.
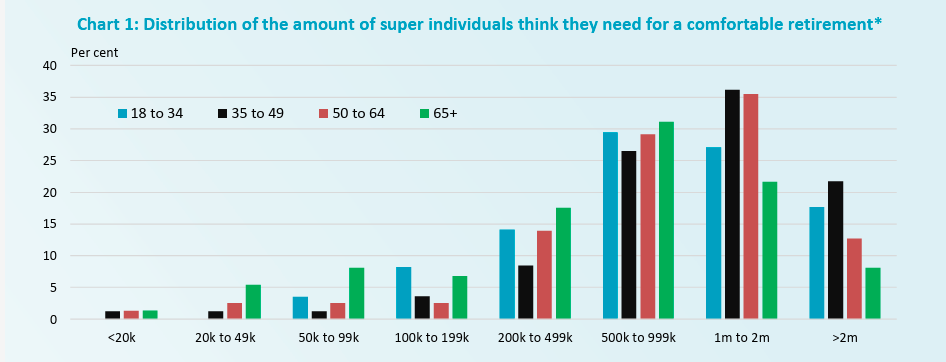
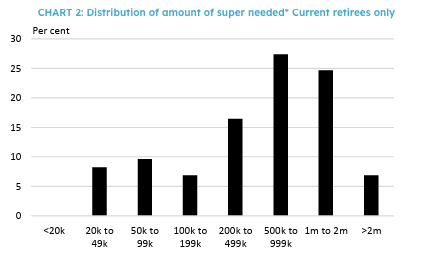
Chart 2 shows the distribution of responses of people who are currently retired. Given that the majority of this cohort are aged 65+, it is not surprising that the distribution in Chart 2 is similar to that for the 65+ age cohort in Chart 1 (green bars).
Most of our Homeowners find that the first 10 years of their retirement are their peak spending period. So, while you might start out requiring a higher level of income, after a period of time most people generally start to slow down and thus tend to require less funds.
But what about holidays, a new car or house repairs? Do you want to leave anything behind for the kids or S.K.I (as they say – Spending the Kids Inheritance)? As you can see there are many different factors that come into play when considering the question of how much do I need?
Speak to your financial advisor for more advise before considering or changing your financial position.
Information in this article is true and correct as of 13 February 2026.
Back to Newsroom